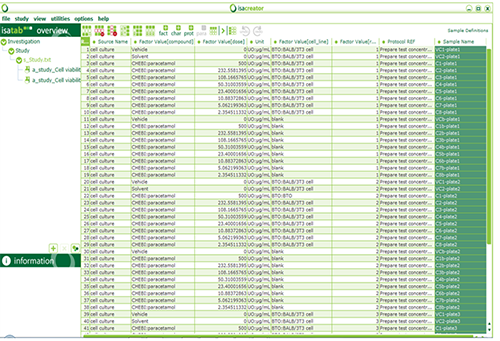
The workflow (the experimental graph) of an example dose –response study using 96 wells plate is shown on the next figure. The study file describes the step of obtaining samples with specified cell culture (compound, concentration and cell line specified by Factor Value fields).
The protocol is simply referred as “prepare test concentration”. For the sake of simplicity, the range finding experiments are not described, but in principle could be included as additional steps. Note that at the end of the workflow (the right column Sample Name) we have unique identifiers for each combination of plate replicate/ compound concentration/ vehicle and cell culture or blank. The same Sample Name will appear at the beginning of the assay files.
The following notations are used: VC1 and VC2 = VEHICLE CONTROL; C1 – C8 = Test Chemicals or PC (SLS) at eight concentrations (C1 = highest, C8 = lowest); b = BLANKS (Test chemical or PC, but contain no cells); VCb = VEHICLE CONTROL BLANK (contain no cells).
Link to the Creating Studies video Tutorial.
Proceed to: